
This article is the 20th entry in the CAMPHOR- Advent Calendar 2015.
(For more about CAMPHOR-, visit https://camph.net/)
Hello, I am @morishin127.
Recently, it has become popular among CAMPHOR- members to use Bitcoin for splitting bills and reimbursements. It’s somewhat like using LINE Pay.
Once I started holding some Bitcoin, I became interested in the daily fluctuating rates, so I would occasionally Google to check the charts. I thought it would be convenient to get the chart by talking to a bot, so I created an API that returns chart images.
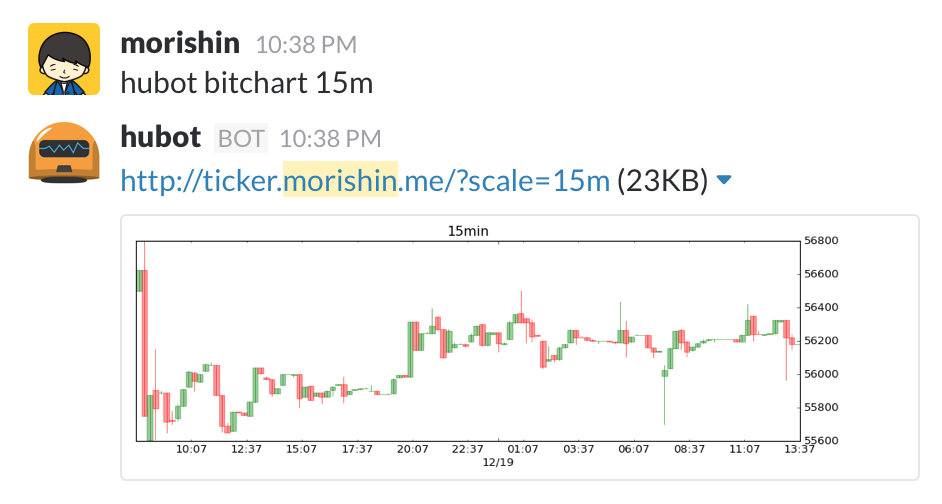
By hitting http://ticker.morishin.me/ https://ticker.arukascloud.io/, you can get real-time chart images.
You can use ?scale=15m for 15-minute candlesticks and ?scale=1d for daily candlesticks. (The default is 5-minute candlesticks.)
Here is the repository.
There is a Docker repository, so
docker pull morishin127/bitchart-api
docker run -itd -p 80:8080 morishin127/bitchart-api
should get it running.
Implementation#
What I used:
- Python 3
- Bottle
- pandas
- matplotlib
- Docker
Obtaining Rate Information#
I used the coincheck API to get the Bitcoin rate.
By hitting https://coincheck.jp/api/ticker, you can obtain the current price information in the following format:
{
  "last": 55621,
  "bid": 55694,
  "ask": 55715,
  "high": 56552,
  "low": 54927,
  "volume": "1835.34189941",
  "timestamp": 1450547505
}
This API is called every minute to INSERT the last value into the database.
Drawing Charts with pandas + matplotlib#
As I INSERT into the database, I also generate and save chart images up to that point. The data selected from the database is converted into a pandas DataFrame, and a candlestick chart is drawn using matplotlib's functionality. I used matplotlib.finance.candlestick_ohlc.
I combined all these processes into a single script and set it to run every minute using crontab.
Distributing Chart Images#
I set up a web server with Bottle, and when a request comes in, it returns the images saved in files.
Docker#
I deployed this on a suitable server using Docker and pointed the domain to ticker.morishin.me.
I closed the server I was using and migrated to Sakura's Arukas → https://ticker.arukascloud.io/
The Arukas setup looks like this, and you can start it by specifying PORT=80.

The Dockerfile looks like this.
I wasn't sure about the dependency libraries, so I referred to this 🙏 http://fits.hatenablog.com/entry/2015/10/29/212833
I chose Docker because I got stuck with manual environment setup... I tried to get it running smoothly on my rented VPS (Debian), but I got stuck installing libraries like matplotlib on virtualenv, so I thought it would be easier to use a Dockerfile that someone else had already successfully built.
By the way, I also got stuck installing docker-engine on that Debian machine (weak), and eventually, I ended up purchasing an instance with a pre-installed Docker environment on DigitalOcean.
DigitalOcean's One-Click Apps are super convenient...

Hubot#
With this, you can write a Hubot script like the one below to have Hubot return charts in chat.
module.exports = (robot) ->
  robot.hear /bitchart\s*(\d+[mhd])?/, (res) ->
    query = res.match[1] ? "5m"
    res.send "https://ticker.arukascloud.io/?scale=" + query
For more details, please check the repository.
Tomorrow's article will be about keishake. Stay tuned!